Recently I was investigating memory leak in one of our web sites. The same story, site consuming more and more memory until IIS finally recycles it.
As usually, executed two standard commands:
.cordll -ve -u -l
!DumpHeap -stat
And then I found our class Xyz at about 10th place from bottom. Interesting. Then I executed following command:
!DumpHeap -short Namespace.Xyz
And immediately pressed Ctrl+Break to have only few hundred of them and not all of them. And then I executed this command to find how is holding that reference:
!GCRoot <address of Namespace.Xyz object>
From output I found some singleton class with
ConcurrentDictionary<Guid, List< Namespace.Xyz>>.
[...Read More]
I was investigating some dead lock that happens in our application. Here is call stack of main thread:
ntdll!NtWaitForSingleObject+0x14
KERNELBASE!WaitForSingleObjectEx+0x93
clr!CLREventWaitHelper2+0x3c
clr!CLREventWaitHelper+0x1f
clr!CLREventBase::WaitEx+0x71
clr!WKS::GCHeap::WaitUntilGCComplete+0x2e
clr!Thread::RareDisablePreemptiveGC+0x18f
clr!StubRareDisableHRWorker+0x38
clr!COMToCLRWorker+0x19d612
clr!GenericComCallStub+0x57
SomeDll!SomeFunction+0x62
ntdll!LdrpCallInitRoutine+0x6f
ntdll!LdrpInitializeNode+0x1c1
ntdll!LdrpInitializeGraphRecurse+0x80
ntdll!LdrpPrepareModuleForExecution+0xc5
ntdll!LdrpLoadDllInternal+0x199
ntdll!LdrpLoadDll+0xa8
ntdll!LdrLoadDll+0xe4
hmpalert!CVCCP+0x67eb
KERNELBASE!LoadLibraryExW+0x161
KERNELBASE!LoadLibraryExA+0x31
KERNELBASE!LoadLibraryA+0x3f
0x00007ffa`0fec9ece
...
clr!ExecuteEXE+0x3f
clr!_CorExeMainInternal+0xb2
clr!CorExeMain+0x14
mscoreei!CorExeMain+0x112
mscoree!CorExeMain_Exported+0x6c
kernel32!BaseThreadInitThunk+0x14
ntdll!RtlUserThreadStart+0x21
Ok, it looks like main thread is waiting for GC to finish. But what is GC doing? And it looks GC related code is here:
ntdll!NtWaitForSingleObject+0x14
KERNELBASE!WaitForSingleObjectEx+0x93
clr!CLREventWaitHelper2+0x3c
clr!CLREventWaitHelper+0x1f
clr!CLREventBase::WaitEx+0x71
clr!`anonymous namespace'::CreateSuspendableThread+0x10c
clr!GCToEEInterface::CreateThread+0x170
clr!WKS::gc_heap::prepare_bgc_thread+0x4c
clr!WKS::gc_heap::garbage_collect+0x1836b7
clr!WKS::GCHeap::GarbageCollectGeneration+0xef
clr!WKS::GCHeap::Alloc+0x29c
clr!JIT_New+0x339
...
mscorlib_ni!System.Threading.Tasks.Task.Execute()$##6003FAD+0x47
mscorlib_ni!System.Threading.ExecutionContext.RunInternal(System.Threading.ExecutionContext, System.Threading.ContextCallback, System.Object, Boolean)$##6003AEF+0x172
mscorlib_ni!System.Threading.ExecutionContext.Run(System.Threading.ExecutionContext, System.Threading.ContextCallback, System.Object, Boolean)$##6003AEE+0x15
mscorlib_ni!System.Threading.Tasks.Task.ExecuteWithThreadLocal(System.Threading.Tasks.Task ByRef)$##6003FBA+0x231
mscorlib_ni!System.Threading.Tasks.Task.ExecuteEntry(Boolean)$##6003FB9+0xa1
mscorlib_ni!System.Threading.ExecutionContext.RunInternal(System.Threading.ExecutionContext, System.Threading.ContextCallback, System.Object, Boolean)$##6003AEF+0x172
mscorlib_ni!System.Threading.ExecutionContext.Run(System.Threading.ExecutionContext, System.Threading.ContextCallback, System.Object, Boolean)$##6003AEE+0x15
mscorlib_ni!System.Threading.ExecutionContext.Run(System.Threading.ExecutionContext, System.Threading.ContextCallback, System.Object)$##6003AED+0x55
mscorlib_ni!System.Threading.ThreadHelper.ThreadStart(System.Object)$##6003BFF+0x60
clr!Thread::intermediateThreadProc+0x8b
kernel32!BaseThreadInitThunk+0x14
ntdll!RtlUserThreadStart+0x21
All other
[...Read More]
When I am working with WinDbg and .NET I usually using following command to load .NET support Dll into WinDbg:
.cordll -ve -u -l
But in case of .NET Core it does not work. It took me quite some time to figure out what to do. Firstly, install dotnet-sos tool into dotnet:
dotnet tool install -g dotnet-sos
Then activate dotnet-sos tool by execution this command:
dotnet-sos install
And this will copy support dll to C:\Users\<username>\.dotnet\sos\sos.dll, where <username> is your username on this computer. These two commands you need to execute only once per .NET Core version or after tool is updated.
And lastly to load this dll into WinDbg, execute this
[...Read More]
How to get to Exception object in .NET when native code calls it
Few day ago, I did investigate crash dump where .NET code raised some exception. Some .NET code called from native host using COM interface. .NET wraps such calls in try catch and return proper HRESULT to caller in native code in case of exception. In my case that .NET method failed and return failed HRESULT. Then due to unforeseen design issues, native code crashed and as result Windows created crash dump and terminated process.
Normally in most native languages when exception is raised, exception object of some kind is created and when exception handled somewhere, this object is destroyed and after that there is no way to
[...Read More]
Imagine you have some field myIntf of type IMyInterface in some class and that interface is implemented in native code. In some cases, it is useful to know which thread was used to introduce this interface to .NET first time. It is useful, because this interface would be connected/attached to that thread and call of any function from that interface will attempt to marshal execution to that thread, unless it is free threaded. And this thread could be blocked, destroyed etc.
So, imagine you have following code:
myIntf.Func1();
If you add
Debug.Break(); before this line code and run your application from WinDbg and wait until execution will stop. Next, press
[...Read More]
Disclaimer. This is perhaps not a best way to do, but I couldn’t find any better way.
Let’s imagine that you have some Task to run in the background. And that task has to update UI for example progress bar. Or that task has to call some callbacks in context of main thread. For firs case you would use Invoke, for second case you would use
SynchronizationContext.Send. Implementation is very simple. WinForms will add request to queue of requests and post message to main thread and then it wait on request handle to be signaled. Main thread receives message, processes request and signal on request event. Very simple and quite basic. Post is the same as Send but
[...Read More]
In this post I will explain my investigation about handle leaks and how it resulted in interesting discovery in MemoryCache class.
I received few reports stating that our application consuming handles even when it supposed to do nothing. And then I started my investigation. I explained how to find where is leaking handles here.
After application leaked about 50 handles, I paused application and checked call stack. And to my surprise I found a lot of callstack that looks like this:
ntdll!NtCreateThreadEx+0x0000000000000014
KERNELBASE!CreateRemoteThreadEx+0x0000000000000294
KERNELBASE!CreateThread+0x000000000000003b
verifier!AVrfpCreateThread+0x00000000000000bf
clr!Thread::CreateNewOSThread+0x00000000000000b2
clr!Thread::CreateNewThread+0x0000000000000091
clr!ThreadpoolMgr::CreateUnimpersonatedThread+0x00000000000000cb
clr!ThreadpoolMgr::MaybeAddWorkingWorker+0x000000000000011c
clr!ManagedPerAppDomainTPCount::SetAppDomainRequestsActive+0x0000000000000024
clr!ThreadpoolMgr::SetAppDomainRequestsActive+0x000000000000003f
clr!ThreadPoolNative::RequestWorkerThread+0x000000000000002b
--------------------------------------
ntdll!NtCreateEvent+0x0000000000000014
verifier!AVrfpNtCreateEvent+0x0000000000000080
KERNELBASE!CreateEventW+0x000000000000006b
verifier!AVrfpCreateEventW+0x00000000000000a5
clr!CLREventBase::CreateManualEvent+0x000000000000003a
clr!Thread::AllocHandles+0x000000000000007b
clr!Thread::CreateNewOSThread+0x000000000000007f
clr!Thread::CreateNewThread+0x0000000000000091
clr!ThreadpoolMgr::CreateUnimpersonatedThread+0x00000000000000cb
clr!ThreadpoolMgr::MaybeAddWorkingWorker+0x000000000000011c
clr!ManagedPerAppDomainTPCount::SetAppDomainRequestsActive+0x0000000000000024
clr!ThreadpoolMgr::SetAppDomainRequestsActive+0x000000000000003f
clr!ThreadPoolNative::RequestWorkerThread+0x000000000000002b
mscorlib_ni!DomainNeutralILStubClass.IL_STUB_PInvoke()$##6000000+0x0000000000000069
From this callstack it wasn’t really obvious what part of
[...Read More]
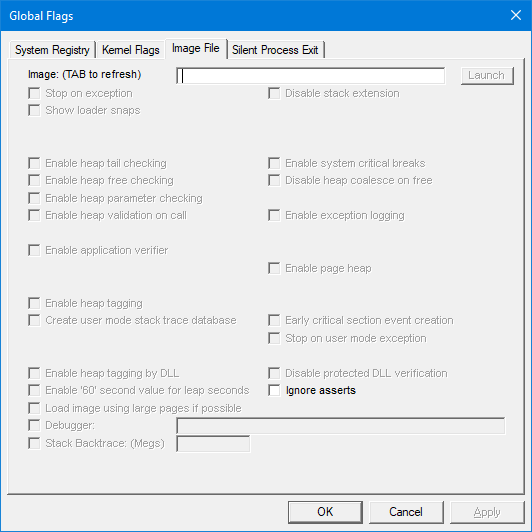
I received few reports stating that our application consuming handles even when it supposed to do nothing. And then I started my investigation. At the beginning I would like to find if it is possible to find handle leaks with some tools. And I immediately found video by Jeff Dailey I believe: https://channel9.msdn.com/Blogs/jeff_dailey/Understanding-handle-leaks-and-how-to-use-htrace-to-find-them who explained how to do it. This video is more than 13 years old. I will explain steps here, because I really hate videos. It is much faster to read than watch.
You need to run C:\Program Files (x86)\Windows Kits\10\Debuggers\x64\gflags.exe and it is usually installed with Debugging Tools and part of Windows SDK. You will see something like this:
[...Read More]
If you work with COM objects you may accidently attempt to use or create COM object in one thread and accidently use it in another thread. And then unless original thread is free threaded .NET will attempt to switch to original thread.
And from there you will see one of the following outcomes.
- If that thread pump messages, then .NET will attempt to send message to that thread to switch. Sometimes it can lead to deadlock or just long delay if that thread is busy. Main thread usually pumps messages, so usually .NET able to switch to main thread.
- You will get error that Interface is not supported. Sometimes you will get that cryptic message even that interface is clearly supported. You will get this message because .NET don’t know how to marshal to original thread, specially if this is some background thread. In this case .NET is not able to marshal, so it will ask object itself to marshal by requesting few interfaces and one of them is IMarshal. Most objects do not support these interfaces and you will see that error message
- When original thread was terminated, or if that was thread pool thread and it will clean its state on next request. In this case you will get this one from MDA: Managed Debugging Assistant 'DisconnectedContext' : 'Transition into COM context 0xed058 for this RuntimeCallableWrapper failed with the following error: The object invoked has disconnected from its clients. (Exception from HRESULT: 0x80010108 (RPC_E_DISCONNECTED)). This is typically because the COM context 0xed058 where this RuntimeCallableWrapper was created has been disconnected or it is busy doing something else. Releasing the interfaces from the current COM context (COM context 0xec968). This may cause corruption or data loss. To avoid this problem, please ensure that all COM contexts/apartments/threads stay alive and are available for context transition, until the application is completely done with the RuntimeCallableWrappers that represents COM components that live inside them.'
[...Read More]