Imagine you have some field myIntf of type IMyInterface in some class and that interface is implemented in native code. In some cases, it is useful to know which thread was used to introduce this interface to .NET first time. It is useful, because this interface would be connected/attached to that thread and call of any function from that interface will attempt to marshal execution to that thread, unless it is free threaded. And this thread could be blocked, destroyed etc.
So, imagine you have following code:
myIntf.Func1();
If you add
Debug.Break(); before this line code and run your application from WinDbg and wait until execution will stop. Next, press
[...Read More]
These days many Intel based laptops have two video cards: one that built-in in CPU and much better one. This happens because Intel is not capable to making nice GPU and as result these notebooks works just fine in Windows, but their performance is quite bad for most of the games. Unless of couse you are willing to sacrifice everything in graphics quality. And as result of that manufacturers add secondary, much better GPU, so their customers can play games. AMD has much better GPU in their APU and usually they don’t have second GPU.
And I was asked to check why Minecraft is quite slow on such Intel based laptop. Firstly, I would like to check if Minecraft in
[...Read More]
I was asked to investigate why our application sometimes forcefully terminated by Windows. After first few minutes I did realize that Windows terminated application with STATUS_HEAP_CORRUPTION. After that I asked our QA to follow https://docs.microsoft.com/en-us/windows/win32/wer/collecting-user-mode-dumps and change DumpType to 2 to collect full crash dumps. Unfortunately, after checking few of these reports, I found that application crashing in pretty much random places: WPF rendering, DirectX engine or sometimes even in network stack. It is clear, that corruption happens some time ago and no useful information. I need different approach.
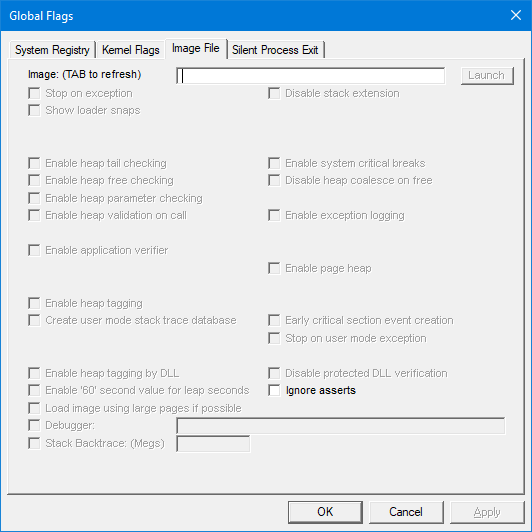
Windows has built-in feature that will allow to find few common problems. To enable these features, you need to install Windows Debugging Tools from Windows SDK and run gflags. Here
[...Read More]
Disclaimer. This is perhaps not a best way to do, but I couldn’t find any better way.
Let’s imagine that you have some Task to run in the background. And that task has to update UI for example progress bar. Or that task has to call some callbacks in context of main thread. For firs case you would use Invoke, for second case you would use
SynchronizationContext.Send. Implementation is very simple. WinForms will add request to queue of requests and post message to main thread and then it wait on request handle to be signaled. Main thread receives message, processes request and signal on request event. Very simple and quite basic. Post is the same as Send but
[...Read More]
In this post I will explain my investigation about handle leaks and how it resulted in interesting discovery in MemoryCache class.
I received few reports stating that our application consuming handles even when it supposed to do nothing. And then I started my investigation. I explained how to find where is leaking handles here.
After application leaked about 50 handles, I paused application and checked call stack. And to my surprise I found a lot of callstack that looks like this:
ntdll!NtCreateThreadEx+0x0000000000000014
KERNELBASE!CreateRemoteThreadEx+0x0000000000000294
KERNELBASE!CreateThread+0x000000000000003b
verifier!AVrfpCreateThread+0x00000000000000bf
clr!Thread::CreateNewOSThread+0x00000000000000b2
clr!Thread::CreateNewThread+0x0000000000000091
clr!ThreadpoolMgr::CreateUnimpersonatedThread+0x00000000000000cb
clr!ThreadpoolMgr::MaybeAddWorkingWorker+0x000000000000011c
clr!ManagedPerAppDomainTPCount::SetAppDomainRequestsActive+0x0000000000000024
clr!ThreadpoolMgr::SetAppDomainRequestsActive+0x000000000000003f
clr!ThreadPoolNative::RequestWorkerThread+0x000000000000002b
--------------------------------------
ntdll!NtCreateEvent+0x0000000000000014
verifier!AVrfpNtCreateEvent+0x0000000000000080
KERNELBASE!CreateEventW+0x000000000000006b
verifier!AVrfpCreateEventW+0x00000000000000a5
clr!CLREventBase::CreateManualEvent+0x000000000000003a
clr!Thread::AllocHandles+0x000000000000007b
clr!Thread::CreateNewOSThread+0x000000000000007f
clr!Thread::CreateNewThread+0x0000000000000091
clr!ThreadpoolMgr::CreateUnimpersonatedThread+0x00000000000000cb
clr!ThreadpoolMgr::MaybeAddWorkingWorker+0x000000000000011c
clr!ManagedPerAppDomainTPCount::SetAppDomainRequestsActive+0x0000000000000024
clr!ThreadpoolMgr::SetAppDomainRequestsActive+0x000000000000003f
clr!ThreadPoolNative::RequestWorkerThread+0x000000000000002b
mscorlib_ni!DomainNeutralILStubClass.IL_STUB_PInvoke()$##6000000+0x0000000000000069
From this callstack it wasn’t really obvious what part of
[...Read More]
I received few reports stating that our application consuming handles even when it supposed to do nothing. And then I started my investigation. At the beginning I would like to find if it is possible to find handle leaks with some tools. And I immediately found video by Jeff Dailey I believe: https://channel9.msdn.com/Blogs/jeff_dailey/Understanding-handle-leaks-and-how-to-use-htrace-to-find-them who explained how to do it. This video is more than 13 years old. I will explain steps here, because I really hate videos. It is much faster to read than watch.
You need to run C:\Program Files (x86)\Windows Kits\10\Debuggers\x64\gflags.exe and it is usually installed with Debugging Tools and part of Windows SDK. You will see something like this:
[...Read More]