How to find leaking handles
- Posted in:
- .NET
- Programming
I received few reports stating that our application consuming handles even when it supposed to do nothing. And then I started my investigation. At the beginning I would like to find if it is possible to find handle leaks with some tools. And I immediately found video by Jeff Dailey I believe: https://channel9.msdn.com/Blogs/jeff_dailey/Understanding-handle-leaks-and-how-to-use-htrace-to-find-them who explained how to do it. This video is more than 13 years old. I will explain steps here, because I really hate videos. It is much faster to read than watch.
You need to run C:\Program Files (x86)\Windows Kits\10\Debuggers\x64\gflags.exe and it is usually installed with Debugging Tools and part of Windows SDK. You will see something like this:
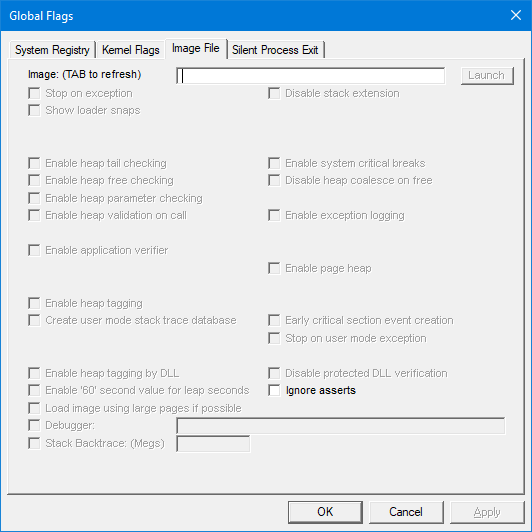
Then type only file name of executable you would like to monitor. I believe it cannot be path to file. For example, notepad.exe and press Tab. Then check “Enable application verifier” checkbox and “Stack backtrace” and enter some value in megabytes. I usually enter 2000 and that should be enough. Then press OK and start your application in WinDbg.
After application finished loading and demonstrate handle leaking you pause application in WinDbg and enter following commands:
!htrace -enable
!htrace -snapshot
And continue program execution and WinDbg will capture any new leaks from now on. When application leaks few handles, you pause it again and enter this command:
!htrace -diff
And this command will show your information about new handles created and where in your code they were created. Very simple and easy. There only one drawback that it saves around 14 callstack items.
I hope it helps