Adventure with Android. Part 2.
I don’t know where I got it, but I know than name of debugger should be lldb. And after searching internet I found that I need to run some commands on Android itself. Basically, you run some application (debugger server) on Android and you run another application on your PC (client). It took me some time but finally I found that Visual Studio has some command line tool in Tools|Android menu but it turns that it just regular Windows command line tool with some predefined environment. After more searching, I realized that I have to type following to start Android command line:
adb shell
Next step would be to start application and attach debugger server to it.
To start application on Android you need following command:
am start -a <intent> -n <package>/<activity>
to find these values you need to extract AndroidManifest.xml from .APK file. Best way to this is to run following command:
"C:\Program Files (x86)\Android\android-sdk\build-tools\28.0.3\aapt.exe" dump xmltree "<Path to Apk file>" AndroidManifest.xml > AndroidManifest.xml
After you got all these values try to start application to make sure that all of these are correct. Alternatively, you can start application normal way. If you want to kill application, you have to use this command:
am force-stop <package>
And now it is time to attach debugger to our application. First thing you need is to run this command to find process id of our application:
ps
you will see something like this:
u0_a14 11410 746 1651560 60052 SyS_epoll_ 00000000 S com.google.android.dialer
u0_a34 11588 746 1652452 45208 SyS_epoll_ 00000000 S com.google.android.calendar
u0_a2 11604 746 1617960 36820 SyS_epoll_ 00000000 S com.android.providers.calendar
u0_a84 11624 746 2020984 155908 SyS_epoll_ 00000000 S <package name>
u0_a52 11838 746 1843432 70600 SyS_epoll_ 00000000 S com.google.android.talk
u0_a52 11871 746 1827068 58988 SyS_epoll_ 00000000 S com.google.android.talk:matchstick
u0_a13 12015 746 1799348 63628 SyS_epoll_ 00000000 S com.google.android.gms.unstable
u0_a13 12508 746 1780896 55076 SyS_epoll_ 00000000 S com.google.android.gms.ui
and find application you need by looking at last column for <package name> you got from AndroidManifest.xml file. Second column is process id of that application. In my example it will be 11624. Keep in mind it will be different every time you start application.
Next and very important step is to elevate yourself to root. Attaching debugger requires admin privileges. To elevate yourself you need to run this command:
su
Next step is to attach debugger to our application by running this command:
gdbserver :<port number> --attach <process id>
Port number needs to be any available port. I usually use 5045 and if it unavailable then try next one until I found free port. So, in my case command will look like this:
gdbserver 5045 --attach 11624
Keep in mind that this command will not exit and will continue to run. Upd: in new versions you may need to put tcp: before port number so it will looks:
gdbserver tcp:5045 --attach 11624
Next step is to connect TCP port of emulator to local machine to allow connect debugger client to debugger server running on the emulator. To do this you need to run this command in new adb shell session:
adb forward tcp:5045 tcp:5045
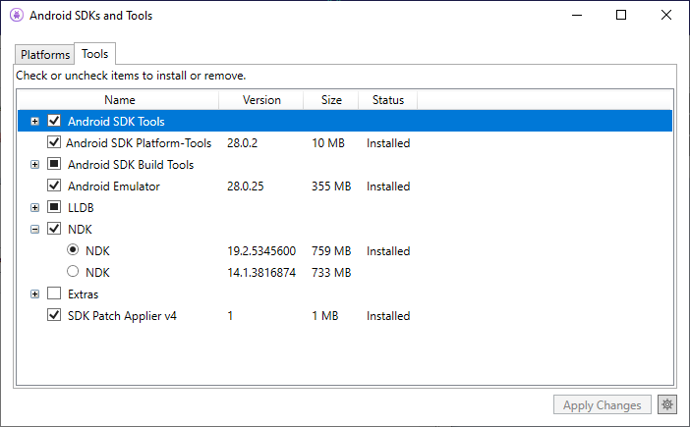
Now it is ready for client connection. Time to find lldb client that runs on Windows. But I couldn’t find it. There is directory C:\Program Files (x86)\Android\android-sdk\lldb but I couldn’t find how to run it. And then I thought that I was starting gdb server so there should be gdb client. After some time, I found one in Mingw tools. But it wasn’t compiled to work with ARM processors. Then I downloaded some official ARM development kit and it was able to connect to client (more on this later) but it wasn’t able to recognize call stack, disassemble anything or see any public name. Bummer. But finally I found how to get correct gdb client. Start Visual Studio, then go Tools|Android|Android SDK Manager. You will see something like this:
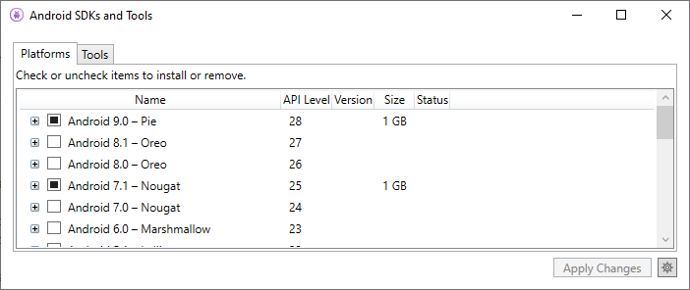
Go to Tools tab, check NDK and select latest one. Then click on Apply Changes button and after some time you will have NDK installed.
On my machine you can find gdb here:
C:\Program Files (x86)\Android\android-sdk\ndk-bundle\prebuilt\windows-x86_64\bin
then you run GDB and type following command:
target remote localhost:5045
you will see a lot of messages about loading symbols for different libraries and finally you will see something like this:
0xb1584b68 in syscall () from target:/system/lib/libc.so
(gdb)
and viola you are connected to application on android. Now it is time to go to my original plan: putting breakpoint on xxtea_decrypt. But before you verify that it is actually present. You can do it by running this command in gdb:
info functions xxt
and you should see something like this:
(gdb) info functions xxt
All functions matching regular expression "xxt":
Non-debugging symbols:
0x96fc7648 xxtea_encrypt
0x96fc77a8 xxtea_decrypt
(gdb)
To put breakpoint on this function use following command:
break xxtea_decrypt
Now it is time to continue execution by running this command:
c
And after some time, application stopped on breakpoint. ABI for ARM processors states that first parameter will be in register R0, second in R1 and third in R2. As you can see from xxtea library source code, key is third parameter and I would like to interpret it as string. To do this you need to run this command:
x/s $r2
Bingo. Now we have key and we can decrypt these files. And it will be in next post.